

The Grid
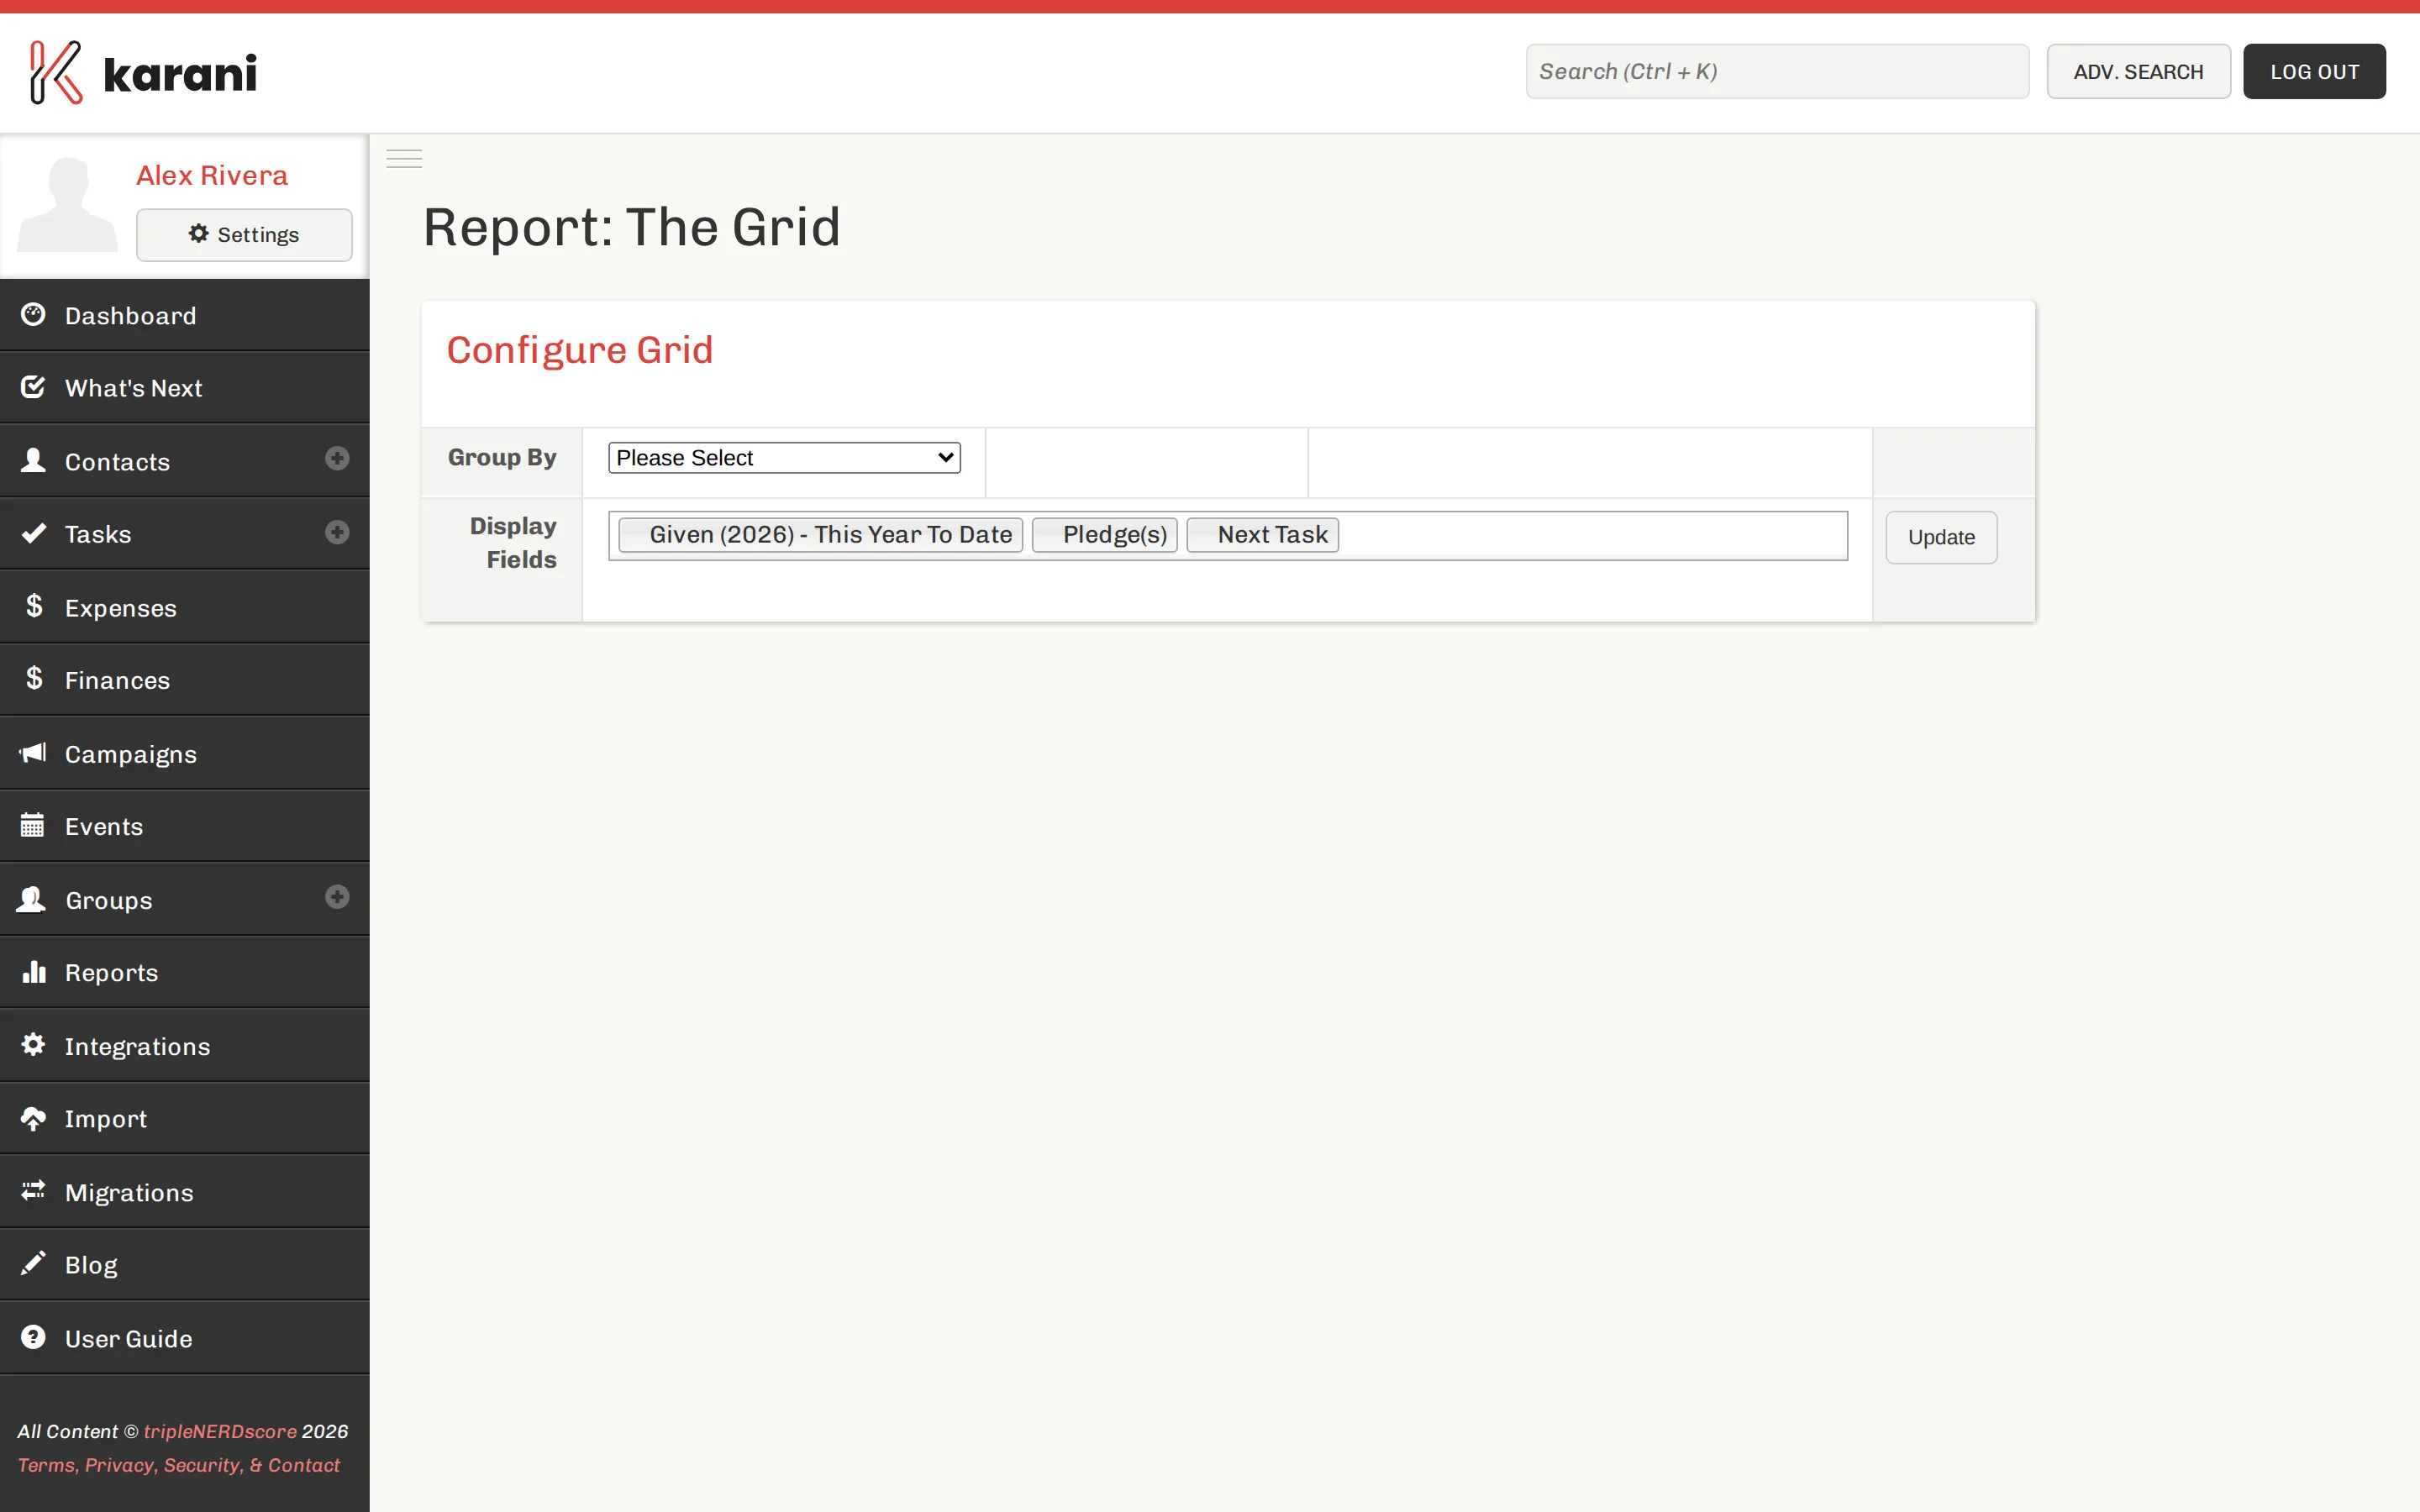
The Grid is the report for questions the other reports don’t answer. You pick the columns, the grouping, the filters, and the sort.
What you control
Section titled “What you control”- Columns — which fields appear, including computed financial ones like total given and lifetime giving
- Grouping — collapse rows by status, group, tag, state
- Filtering — narrow to the population you care about
- Sorting — by any column
Things it’s good for
Section titled “Things it’s good for”Ranking donors by lifetime giving. Add the lifetime giving column, sort descending. This is your major donor list, and most people have never actually looked at it.
Comparing segments. Group by tag or group with giving totals as columns, to see which segments actually give.
Geographic analysis. Group by state with giving totals, to work out where a trip is worth making.
Building a targeted list. Filter to exactly the population you want, then export it.
Finding data gaps. Show the email and address columns and sort — the empty ones float together, and you can see how much of your list you can actually reach.
Exporting
Section titled “Exporting”Export downloads the current view — your columns, your filters, your sort — as CSV. That’s the main reason to use The Grid over advanced search: you control exactly what lands in the spreadsheet.
The Grid vs. advanced search
Section titled “The Grid vs. advanced search”| The Grid | Advanced search | |
|---|---|---|
| Output | A configurable table | A contact list |
| Choose columns | Yes | No |
| Grouping and subtotals | Yes | No |
| Save the configuration | No | Yes, as a saved search |
| Best for | Analysis and export | A list you’ll re-run |
Use advanced search for “show me these people, regularly”. Use The Grid for “let me look at this from a few angles and take a spreadsheet away”.
On a small screen
Section titled “On a small screen”The Grid is a wide table. It works on a phone but it isn’t pleasant. Save it for a laptop.