

Tracking campaign results
The campaign page
Section titled “The campaign page”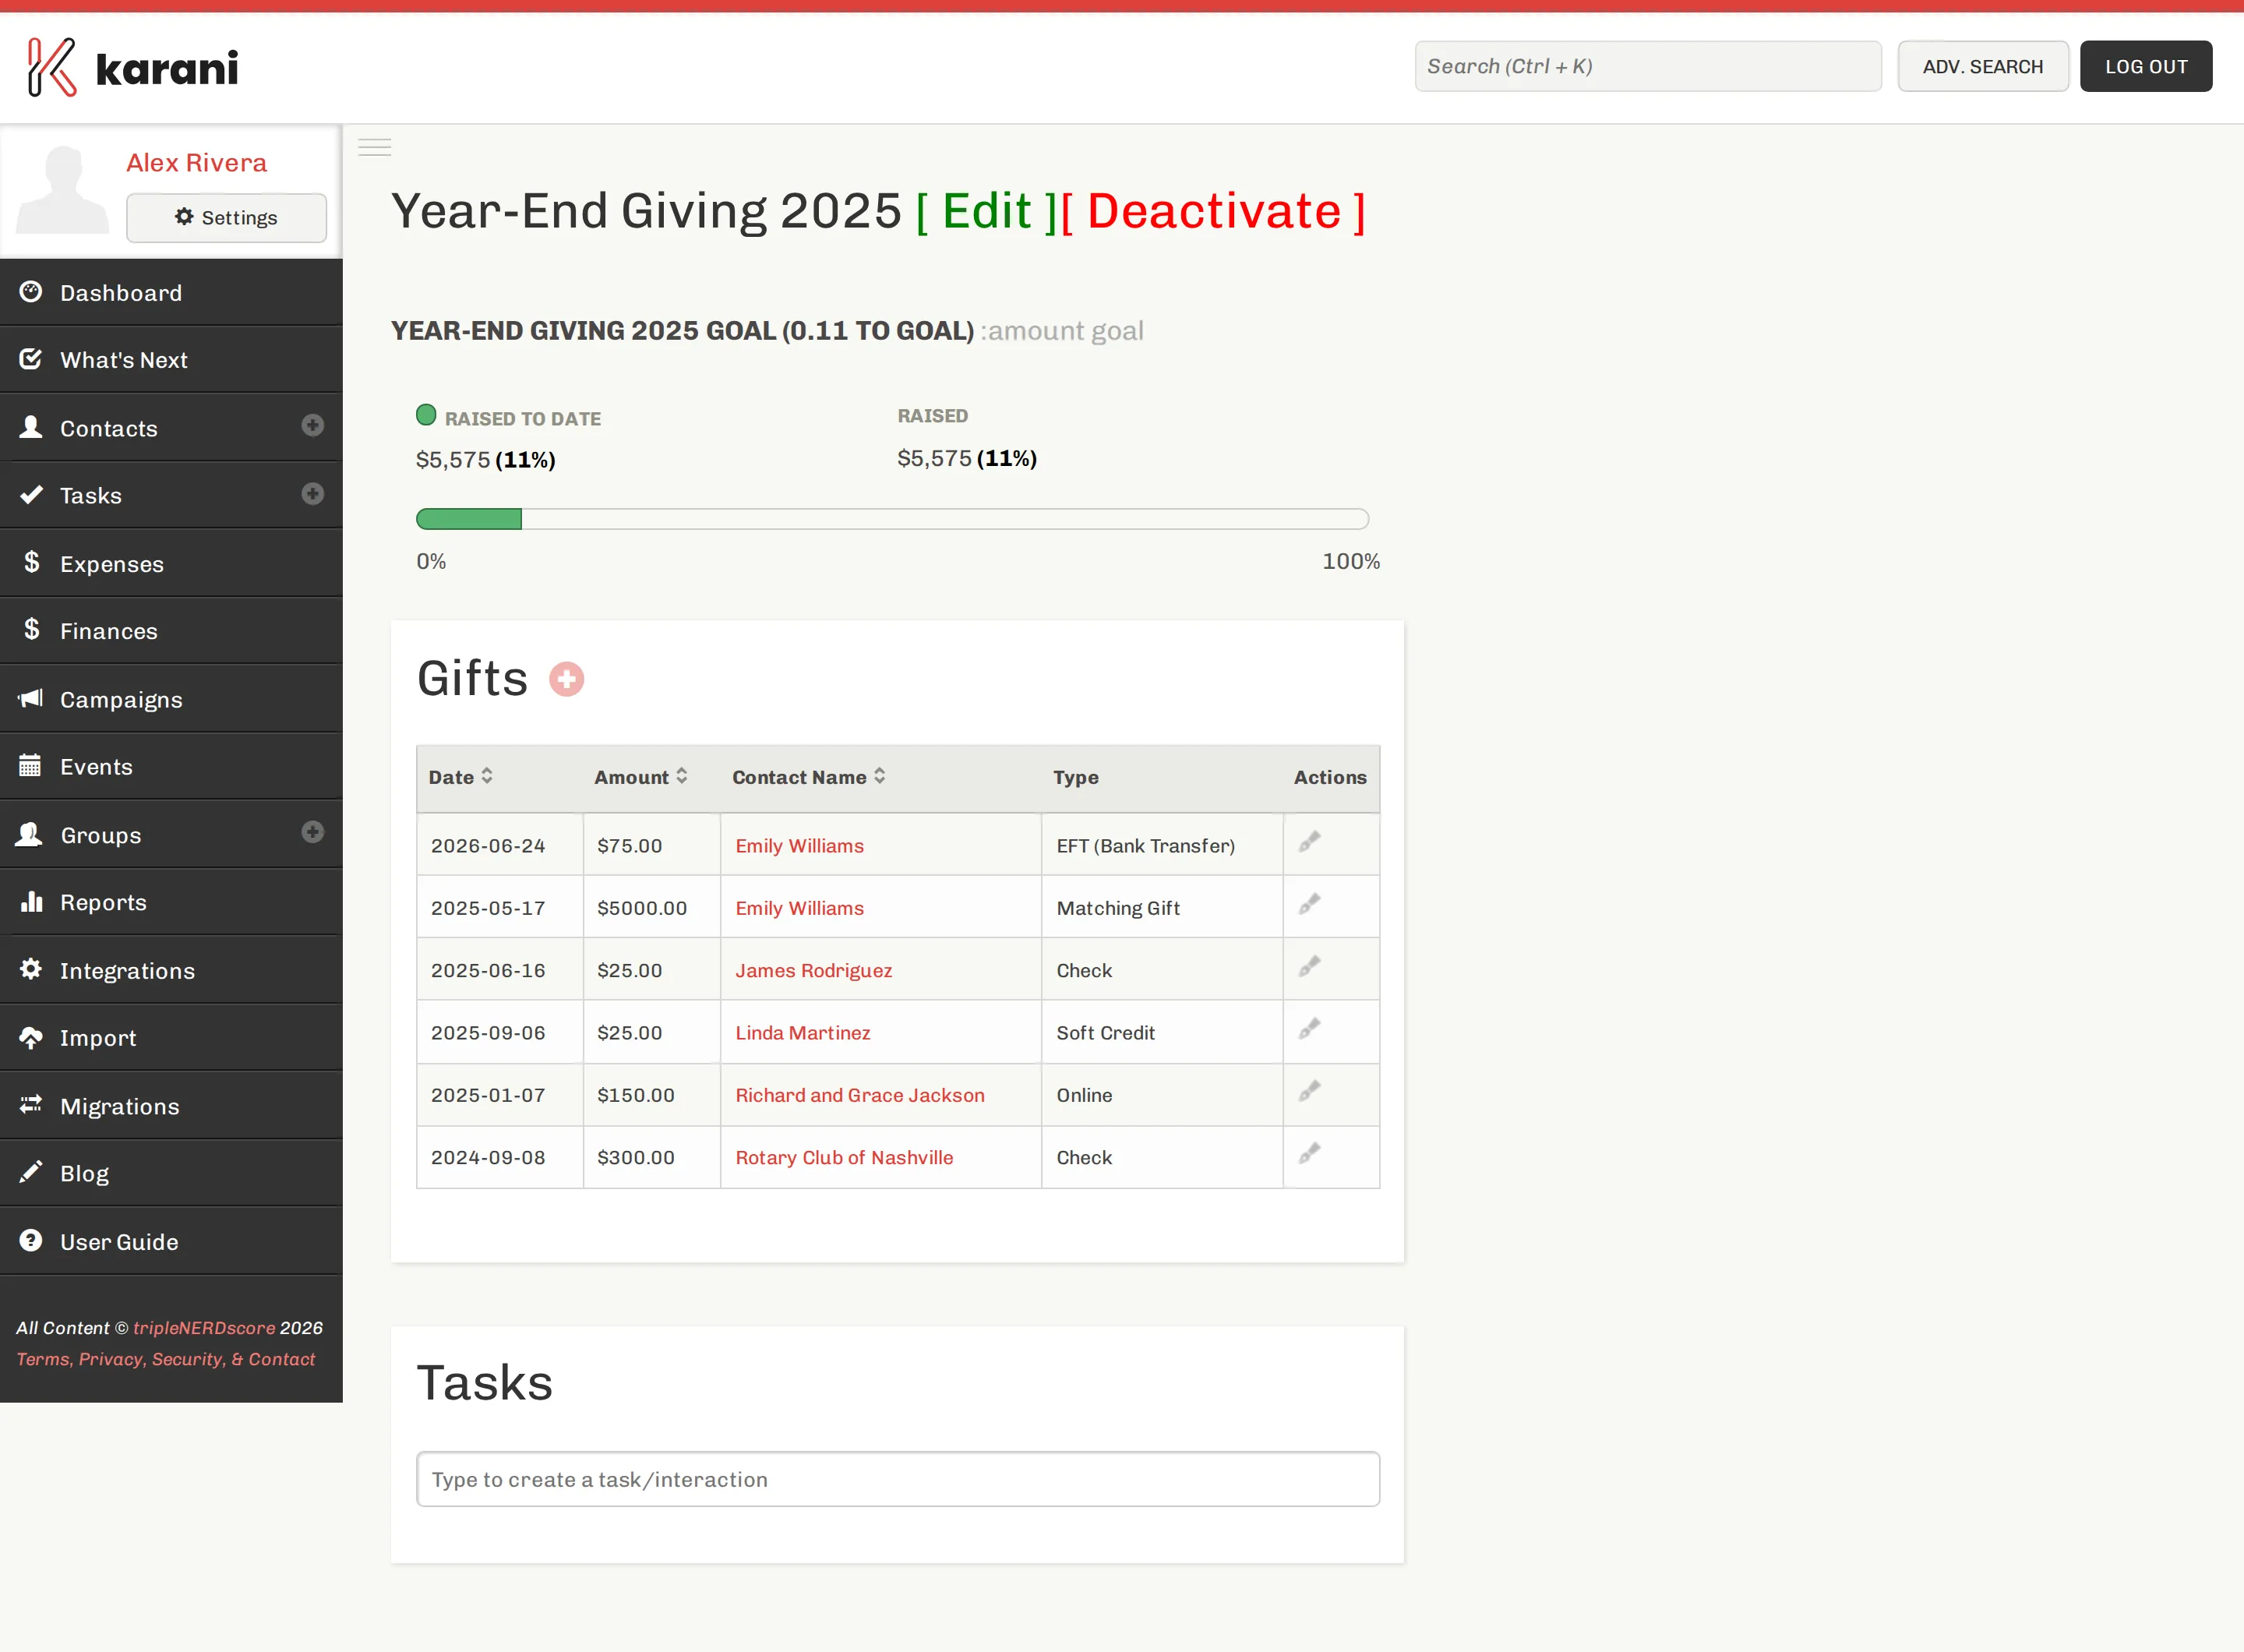
The header shows raised to date and the percentage of goal, with the progress bar underneath.
The Gifts table lists every gift attributed to the campaign — date, amount, contact, and type. Sort by any column. Click a contact to open their profile, or the pencil to edit the gift.
On the dashboard
Section titled “On the dashboard”While a campaign is active, it appears in the Gifts panel on your dashboard with its own progress bar, under the month-to-date and year-to-date bars. It disappears when you deactivate it.
What the campaign actually netted
Section titled “What the campaign actually netted”The campaign page shows gross. To know what an appeal was worth, you need the cost as well.
Track the campaign’s costs as expenses — printing, postage, design, venue — ideally under a category named for the campaign. Then:
Net = raised − campaign expenses
Comparing campaigns
Section titled “Comparing campaigns”Keep deactivated campaigns rather than deleting them, and the Campaigns page becomes your appeal history. Comparing this year’s year-end appeal to last year’s tells you far more than either number alone.
Worth recording somewhere alongside the figures: how many people you asked, how many gave, and what you sent. Karani tracks the money; the response rate comes from knowing the denominator.
Digging deeper
Section titled “Digging deeper”- Gifts Report — filter all gifts by date range and type, and sum them. Useful for slicing a campaign by giving channel.
- The Grid — group contacts by tag or group with giving totals as columns, to see which segments responded.
- Fiscal Year Giving by Donor — per-donor giving by month, which shows whether an appeal pulled forward giving that would have arrived anyway.