

Fiscal Year Giving by Donor
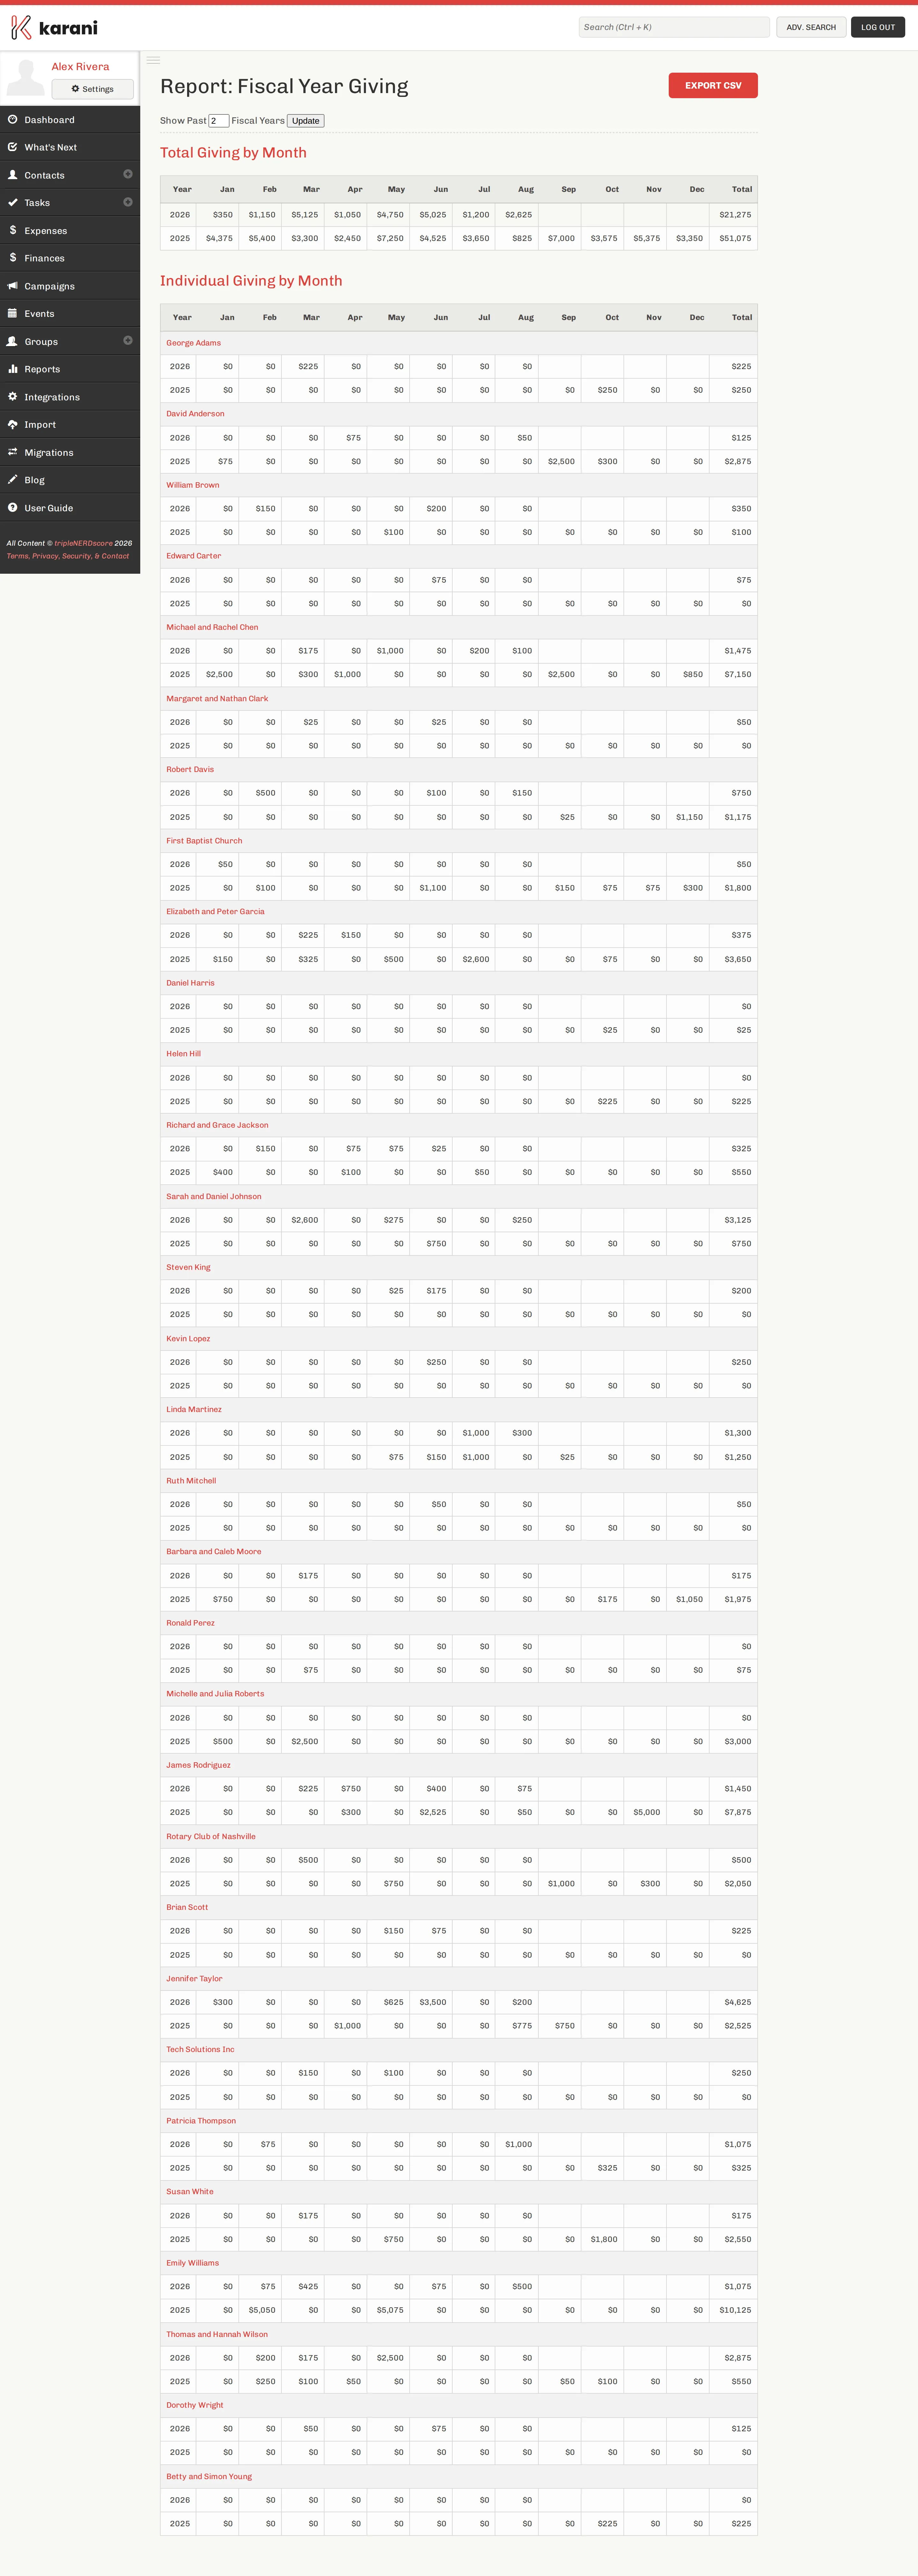
A grid of donors down the side and months across the top, comparing multiple fiscal years.
What it shows
Section titled “What it shows”For each donor, how much they gave in each month, across the fiscal years you’re comparing. Totals at the edges.
What to look for
Section titled “What to look for”Donors who’ve quietly reduced. Someone giving $100 a month who moved to $50 doesn’t trigger any alarm — their gifts keep arriving. Year-over-year is where that shows up.
Donors who’ve quietly increased. Worth noticing and thanking specifically. People who increase their giving unprompted are your most engaged supporters and are rarely acknowledged for it.
Seasonality. If most of your giving arrives in two months, that’s worth knowing for cash-flow planning, and it’s a reason to set monthly gift goals explicitly rather than letting Karani spread the year evenly.
Gaps. A donor with a run of months and then nothing has stopped. They may not be far enough along to appear in Lapsed Donors yet.
Exporting
Section titled “Exporting”Export downloads the grid as CSV — useful for building your own analysis, or for sharing figures with your organisation.
Fiscal year, not calendar year
Section titled “Fiscal year, not calendar year”The columns follow your fiscal year start month from budget settings. If that’s set wrongly, this report is the place you’ll notice — the year boundaries won’t be where you expect.
Note that donor portal statements use the calendar year instead, because they’re for tax purposes. The two won’t agree unless your fiscal year starts in January, and that’s expected.