

Finances overview
The Finances page is the honest answer to “how am I doing?”
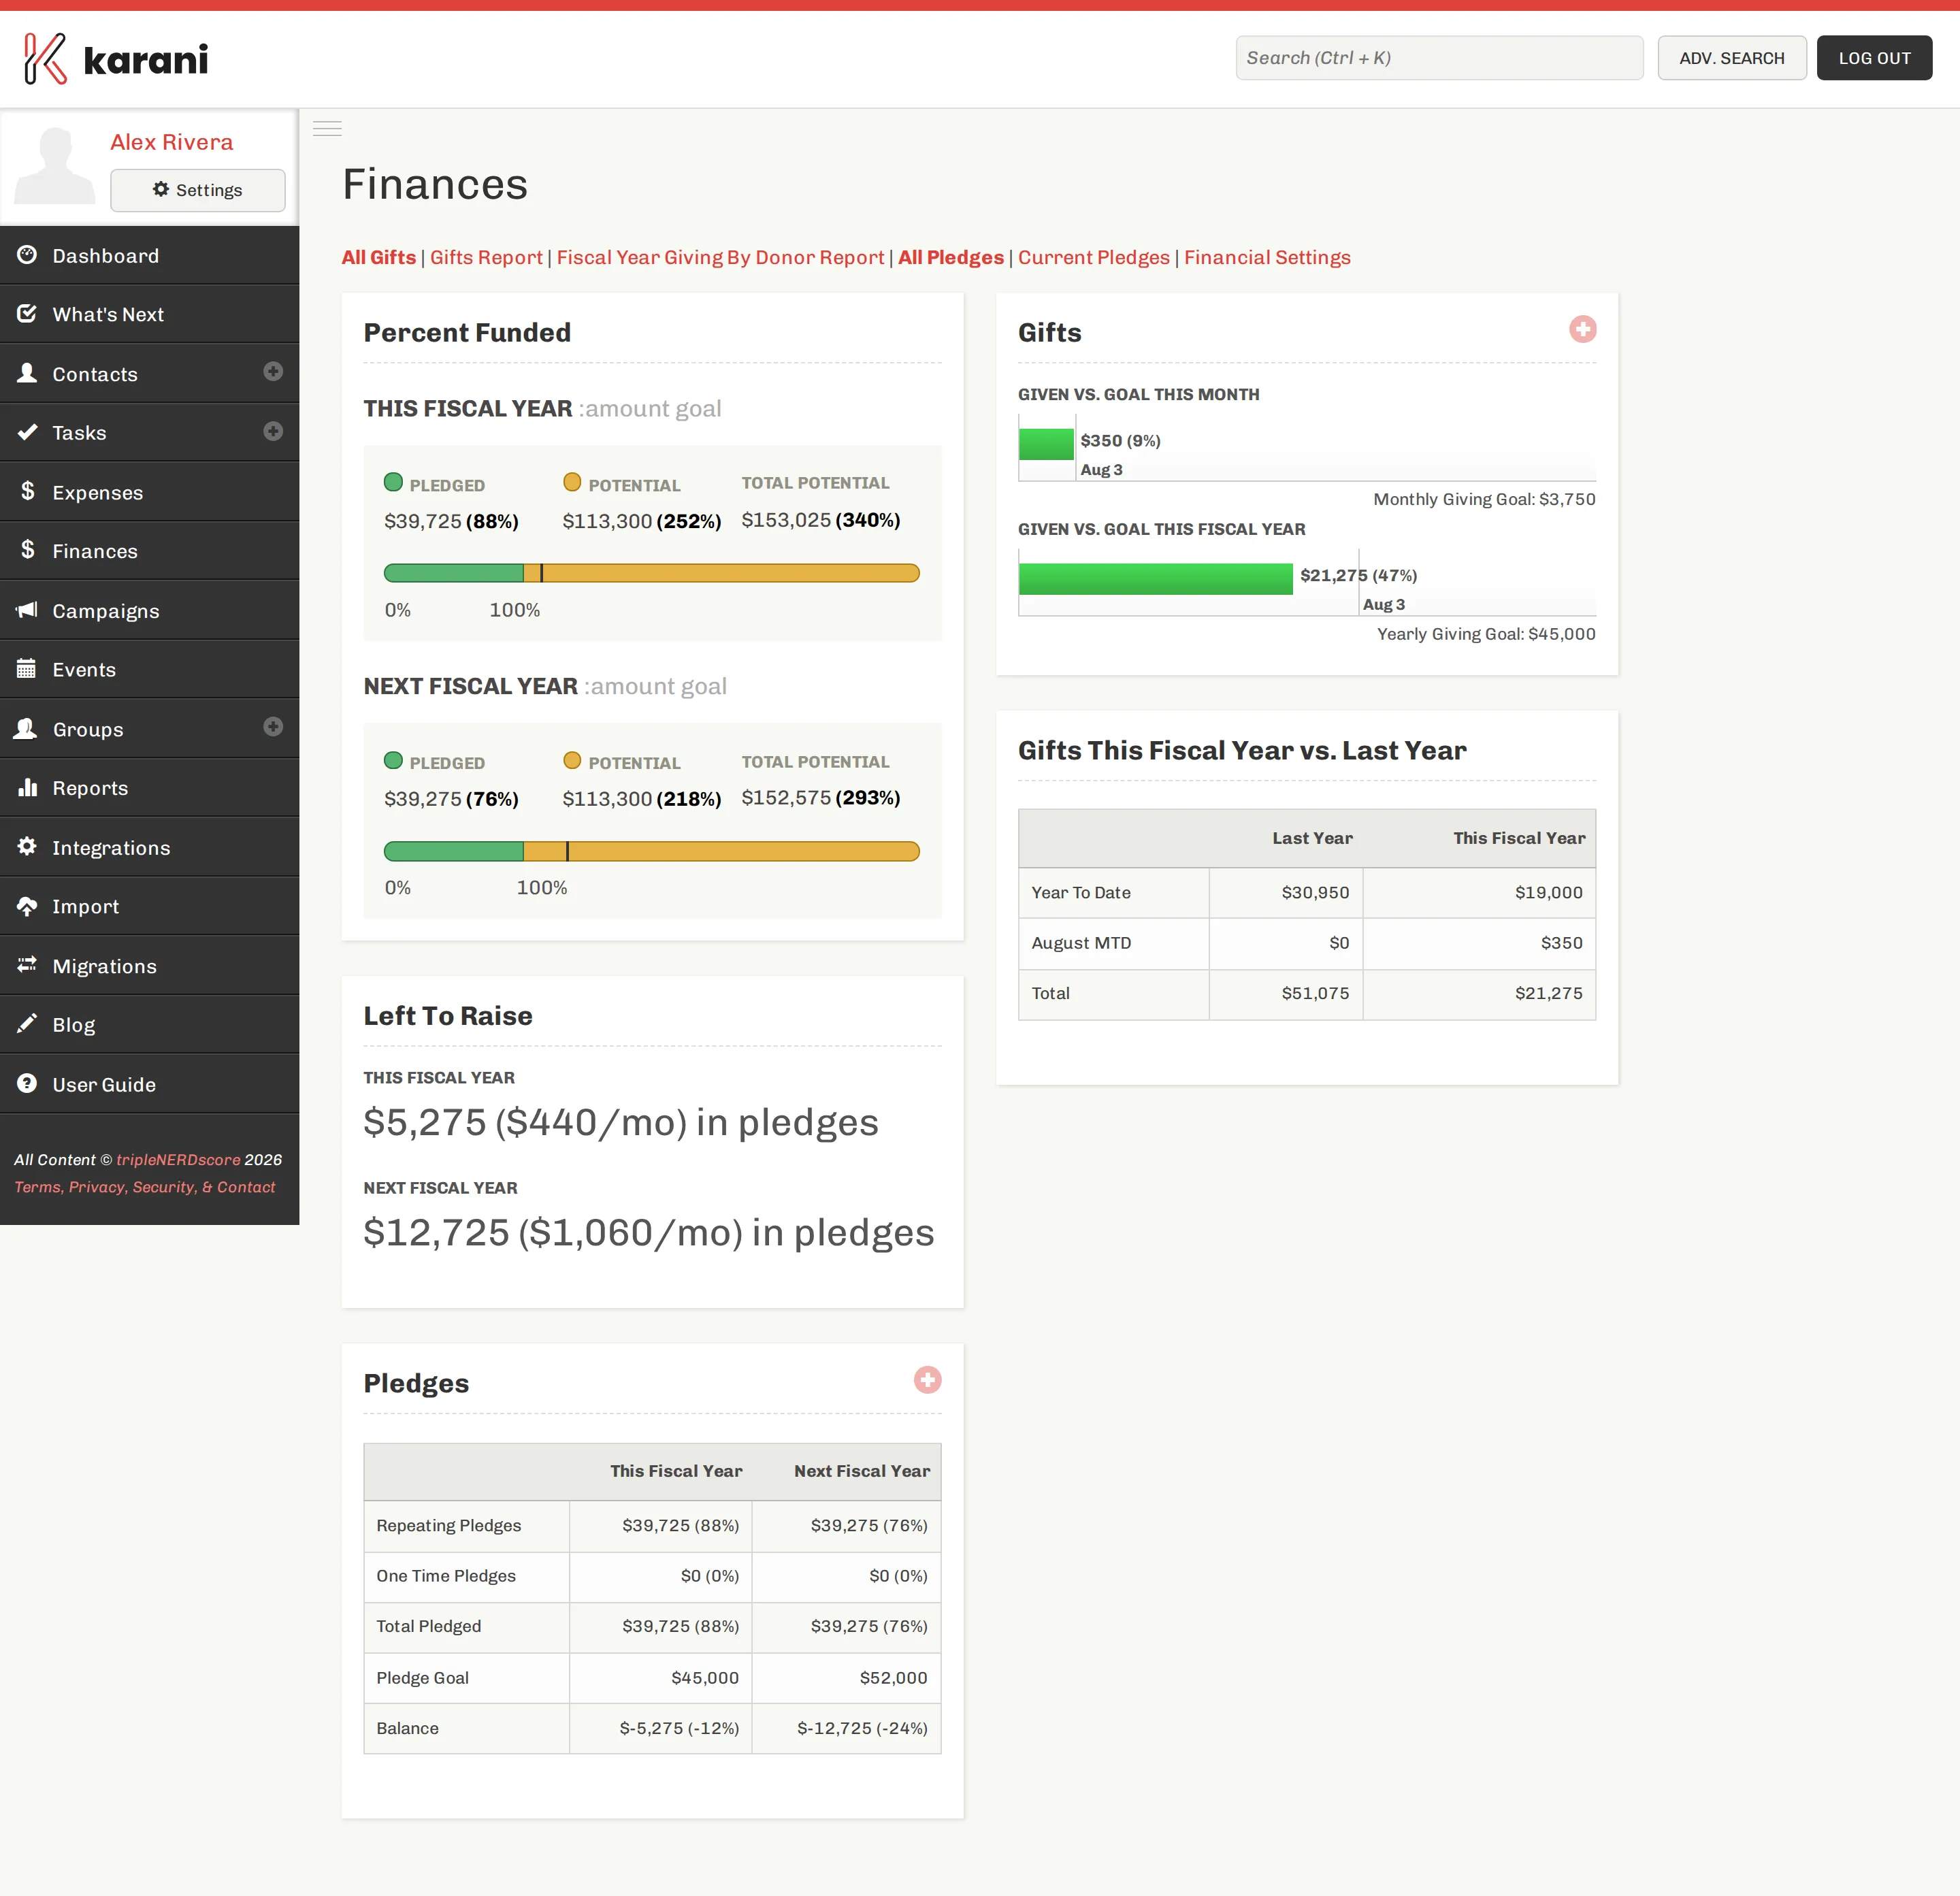
The links along the top
Section titled “The links along the top”- All Gifts — every gift, listed
- Gifts Report — filter and sum gifts
- Fiscal Year Giving By Donor — per-donor giving by month across years
- All Pledges / Current Pledges — the pledge lists
- Financial Settings — jumps to your goals
Percent Funded
Section titled “Percent Funded”Total pledged as a share of your yearly pledge goal, for this fiscal year and next.
Three figures:
- Pledged — what donors have actually committed. This is the real number.
- Potential — the sum of annual potentials you’ve set on your prospects in the Prospective Giving report. This is what you might raise, not what you have.
- Total Potential — pledged plus potential.
Left To Raise
Section titled “Left To Raise”The gap between pledged and goal, shown two ways: as a total, and as a monthly figure for the remainder of the year.
The monthly figure is the more useful of the two. “$5,275 to raise” is abstract; “$440 a month” tells you what a week of work needs to produce.
Pledges
Section titled “Pledges”A table breaking pledged income into repeating and one-time pledges, for this fiscal year and next, against your goal, with the balance.
The + adds a new pledge — see Adding a pledge.
Actual money received against your gift goals, for the current month and the current fiscal year.
If you left the gift goals blank in settings — which is the recommendation — Karani derives them from your pledges.
Gifts This Fiscal Year vs. Last Year
Section titled “Gifts This Fiscal Year vs. Last Year”A three-row comparison: year to date, current month to date, and full-year totals. This is the table to look at when you want to know whether you’re genuinely ahead or behind compared to the same point last year.