

Event dashboard & reports
The dashboard
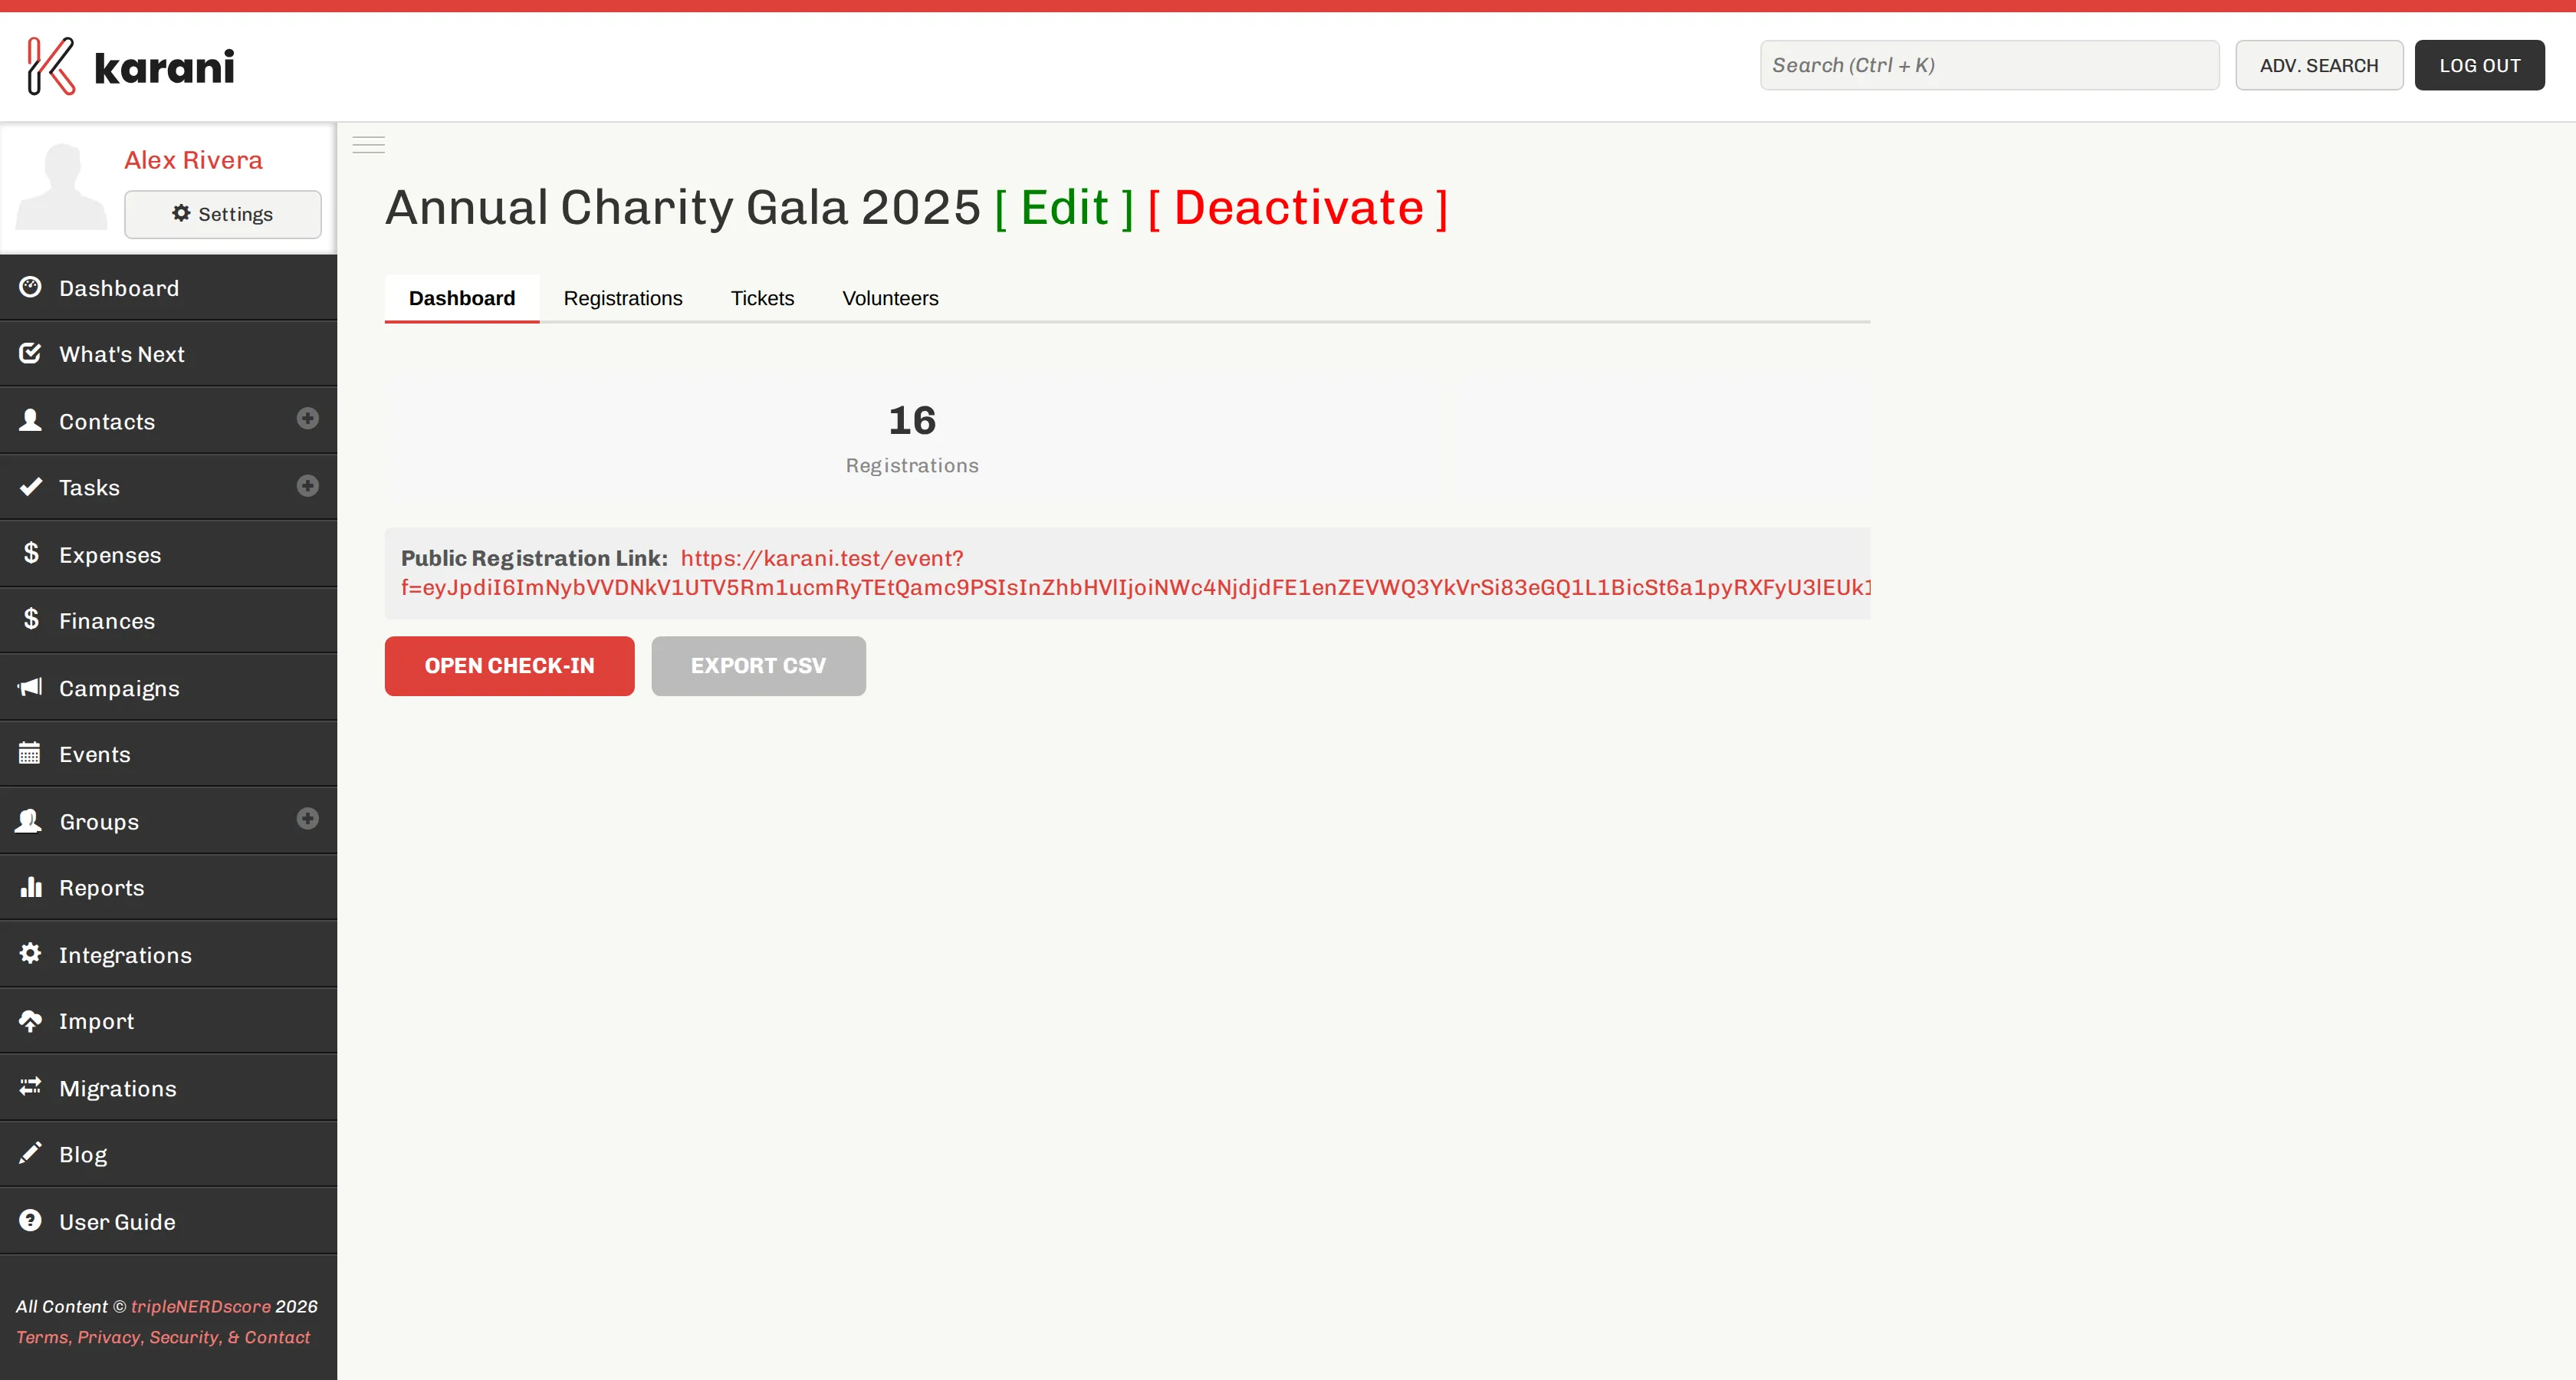
Section titled “The dashboard”The Dashboard tab of an event is its summary.
| Figure | Meaning |
|---|---|
| Total registrations | Sign-ups, including pending. |
| Total revenue | Ticket sales. |
| Total donations | Extra giving on top of tickets. |
| Total attendees | People covered by those registrations. |
| Checked in | How many have actually arrived. |
| Check-in percentage | Checked in as a share of expected. |
| Volunteer roles / volunteers | Roles defined, and people signed up. |
| Capacity used | Attendees against the event’s capacity. |
Also here: the public registration link to share, and buttons for Open Check-In and Export CSV.
The attendee report
Section titled “The attendee report”The report view lists attendees with their registration details — the working list for name badges, seating, and dietary requirements.
Exporting
Section titled “Exporting”Export CSV downloads every registration: names, emails, ticket types, amounts, confirmation numbers, and check-in status.
Use it for:
- A printed backup list for the door
- Name badges and seating plans
- Importing attendees into a group for follow-up
- Reconciling ticket revenue against your processor
After the event
Section titled “After the event”What the event actually raised
Section titled “What the event actually raised”The dashboard shows revenue and donations. To know what it was worth:
Net = ticket revenue + donations − event expenses
Venue, catering, printing, and decoration go in as expenses, ideally under a category named for the event. Events are the fundraising activity where gross and net differ most, and it’s worth knowing by how much before you commit to doing it again.
Numbers worth keeping
Section titled “Numbers worth keeping”Beyond the money, three figures from each event are worth writing down for next time:
- Registered vs. checked in — your no-show rate.
- Capacity used — whether you booked the right size room.
- New contacts created — how many people the event actually added to your list.